Table of Contents
The Cartographer’s Dream: When a Map Becomes a Movie
From Static Chart to Sentient Canvas
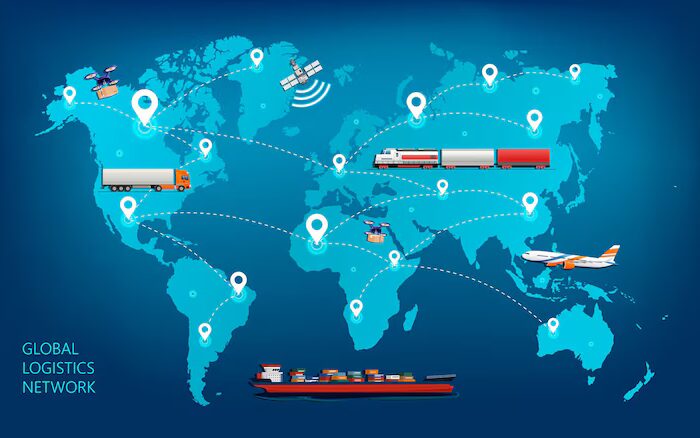
Open any logistics dashboard at sunrise and you will see a globe that breathes. Vessels glow like fireflies, storms bloom in violet petals, and port icons throb with the heartbeat of waiting containers. The modern global shipping lanes map is no longer a piece of paper pinned to a bulkhead; it is a living film whose frames update every heartbeat, stitched together by satellites, algorithms, and the quiet urgency of global appetite.
A single pixel may represent the exact arc where a captain chooses to hug the African coast to shave bunker fuel, a decision that will ripple into the price of coffee in Seattle before the next tide. To read this pixel is to witness the intersection of meteorology, finance, and human desire.
Color as Currency
On the screen, lanes shimmer in gradients that traders learn like childhood prayers. Crimson warns of congestion, indigo promises calm seas, amber hints at piracy alerts, and mint whispers of carbon-cheap detours. These hues are not ornamental; they are the lingua franca of procurement managers who must decide, before breakfast, whether to reroute sneakers or vaccines. Master the palette and you master risk, margin, and narrative all at once.
The Gateways of Gravity: Canals, Straits, and Bottlenecks that Bend the World
Suez: The Slinky That Snapped and Healed
When Ever Given wedged itself athwart Suez, memes spread faster than rerouting memos. Yet behind the jokes lay a revelation: a single canal is a heartbeat through which twelve percent of global trade pulses. The shipping lanes map froze like a paused video game; tankers queued in the Red Sea while algorithms drew ghostly detours around the Cape of Good Hope. The detour added days, dollars, and drama, proving that geography is negotiable when economics demands.
Panama’s Bathtub and the Rain Calendar
Panama’s locks are a porcelain bathtub balanced on tropical rainfall. When drought arrives, the map shrinks; ships lighten their load, shedding cargo like ballast. Avocado prices in Toronto twitch in sympathy with Central American clouds. Cartographers now overlay rainfall forecasts onto shipping charts, turning meteorologists into silent freight brokers.
Malacca’s Pulse and the Pirate Shadow
At night, the Strait of Malacca glows like a fiber-optic cable laid across the sea. Half the world’s oil squeezes through this bottleneck. Pirates, typhoons, and diplomatic flare-ups rewrite the lanes in real time. A smartphone alert can reroute a supertanker south of Java, adding days and drama to every barrel.
Weather as Co-Author: Storms, Monsoons, and the Melting North
Typhoon Alley and the Zigzag Season
From July to October, the Western Pacific becomes a meteorological racetrack. Lanes bend like rubber bands around cyclones, creating detours that feel abstract until your smartwatch buzzes with a delayed-delivery notice. The map updates hourly, a testament to the ocean’s refusal to stay still.
Monsoon Drums and the Arabian Waltz
In the Indian Ocean, monsoons beat like drums. Lanes flip-flop twice a year: eastbound in summer, westbound in winter. Ancient Arab dhows followed the same rhythm; today’s mega-ships obey satellites, but the choreography is unchanged. The map honors tradition by animating arrows that swirl in ancient patterns.
Arctic Corridors and the Melting Shortcut
As polar ice retreats, new lanes appear across the top of the world. The map stretches northward, promising shorter voyages from Shanghai to Rotterdam. Yet the lanes are tentative, guarded by Russian icebreakers and environmental treaties. One red line across the Arctic is a postcard from a warming planet.
Data Layers and the Cartographer’s Palette: AIS, Blockchain, and the Color of Risk
AIS Sparks and the Pulse of Commerce
Every ship broadcasts its soul via AIS: latitude, longitude, speed, and course. These sparks aggregate into constellations that reveal traffic density, piracy zones, and even smuggling patterns. A smuggler’s detour appears as a lone pixel darting away from the herd, a breadcrumb for enforcement agencies.
Blockchain Proof and the Immutable Voyage
Maersk and IBM now log every container on a blockchain ledger. Each waypoint becomes a cryptographic stamp, visible on the map as a glowing waypoint. Buyers can trace coffee beans from Colombian hillside to Brooklyn café, all while watching the lanes shift color with each verified handoff.
Risk Polygons and the Insurance Rainbow
Insurers overlay risk polygons onto shipping lanes: red for war zones, orange for piracy, yellow for weather. These polygons are updated faster than weather apps, guiding underwriters who price risk by the pixel.
Portraits of Change: Micro-Routes that Rewrite Macro-Maps
The Cape Route Renaissance
When Suez choked, the Cape of Good Hope became the world’s detour. The map bloomed with new waypoints, and Cape Town’s waterfront sprouted pop-up bunkering stations. The lanes adapted, proving that geography is negotiable when economics demands.
The Rail-Sea Hybrid from Chongqing to Duisburg
Trains now carry containers from China’s heartland to Germany faster than ships can circle Africa. The map stitches rail and sea into a single ribbon, blurring the line between continent and ocean. The silk road is reborn in pixels.
Island Hubs and the Floating Warehouse
Singapore and Dubai act as floating warehouses where containers swap ships like passengers changing trains. The map zooms into micro-lanes that crisscross within a single harbor.
Future Canvas: Quantum Routing, 3D Printed Ports, and the Cartographer’s Dream
Quantum Routing and the Probabilistic Voyage
Quantum computers now model every possible route simultaneously, assigning probabilities to each scenario. The map becomes a cloud of potential paths, collapsing into the optimal lane only when observed.
3D Printed Breakwaters and Instant Infrastructure
Dubai experiments with printed concrete breakwaters that can be deployed in days, creating new lanes overnight. The map becomes modular, a Lego set for logistics.
Augmented Reality and the Living Globe
Put on AR glasses and the globe spins in your living room. Ships glide past your coffee table, storms swirl above your sofa. The shipping lanes map is no longer on a screen; it is the room.

Conclusion
The global shipping lanes map is a living manuscript written by wind, water, politics, and code. To navigate it is to read a story that updates itself with every gust, every policy, every pixel. Those who learn its language will not only move cargo; they will move the future.
If you want to enhance your global shipping efficiency and enjoy the full-process transfer logistics service and ensure that your goods are easily delivered to overseas addresses,you can use looperbuy, a one-stop purchasing-logistics solution:https://looperbuy.com/.
Related Questions & Answers
· How do real-time weather events update global shipping lanes?
Satellite data feeds risk polygons that reroute vessels within hours, visible as color-coded detours on live maps.
· Why does a canal closure affect global prices so quickly?
Canals are bottlenecks; rerouting adds fuel, time, and insurance premiums, costs that ripple through every invoice.
· What role does AIS data play in modern cartography?
AIS sparks create live traffic maps, revealing congestion, piracy zones, and even smuggling anomalies.
· Can AI predict shipping lane congestion days ahead?
Yes, ML models now forecast lane density using satellite, port, and social data, shifting maps from reactive to predictive.
· Are Arctic shipping lanes reliable year-round?
Not yet; ice conditions, geopolitics, and environmental rules make the lanes seasonal and tentative.
Hot Tags: Global Shipping Lanes; Suez Canal Impact; Panama Canal Drought; Arctic Shipping Routes; AIS Maritime Tracking; Blockchain Supply Chain; Monsoon Trade Winds; Port Congestion Map; Future Shipping Predictions