In the world of academia and scientific research, organization and documentation are crucial for success. A research notebook chart serves as a vital tool for researchers, students, and professionals alike, allowing them to keep track of experiments, observations, and findings in a structured manner. This article will delve into the importance of research notebook charts, how to create and use them effectively, and tips for maintaining an organized research notebook.
Table of Contents
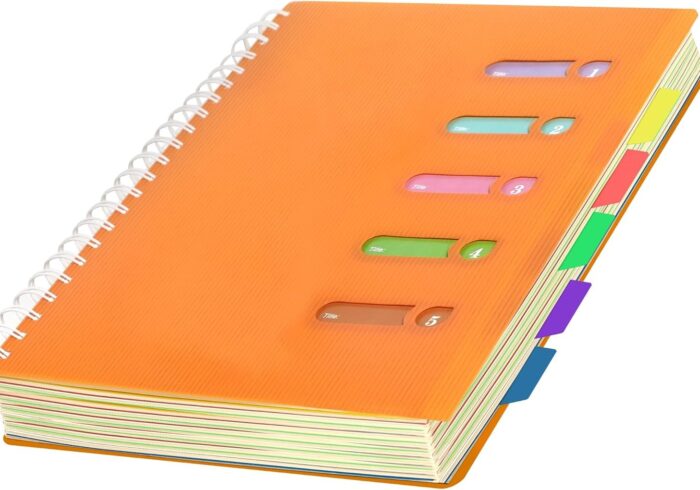
Understanding Research Notebooks
A research notebook is a dedicated space for documenting experiments, observations, and ideas. It serves as a chronological record of your work, providing a comprehensive overview of your research journey. A well-maintained research notebook is essential for reproducibility, accountability, and collaboration in scientific endeavors.
The Purpose of Research Notebooks
Research notebooks serve several key purposes:
- Documentation: They provide a detailed account of experiments, methodologies, and results, ensuring that all relevant information is recorded for future reference.
- Accountability: Keeping a research notebook helps establish ownership of ideas and findings, which is particularly important in collaborative environments.
- Reproducibility: A well-documented research notebook allows others to replicate your experiments, a fundamental principle of scientific research.
- Idea Development: Research notebooks can also serve as a space for brainstorming and developing new ideas, hypotheses, and approaches.
The Importance of Research Notebook Charts
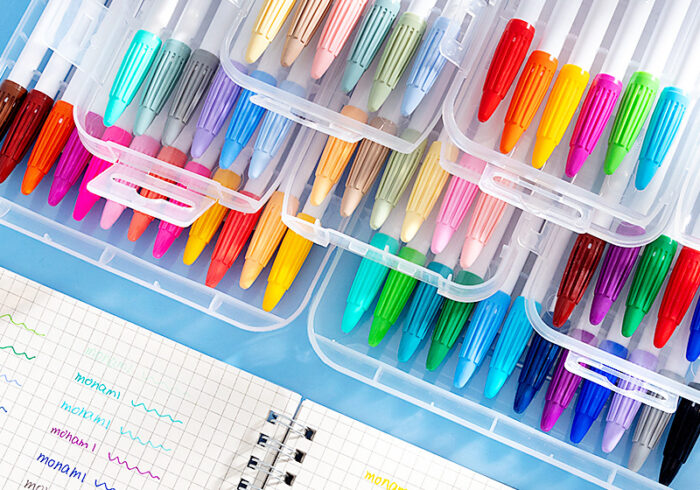
Research notebook charts are visual representations of data and findings that enhance the organization and clarity of your research. They can take various forms, including tables, graphs, and flowcharts, and are used to summarize complex information in an easily digestible format.
Benefits of Using Charts in Research Notebooks
- Clarity: Charts help to present data in a clear and concise manner, making it easier to understand trends and relationships.
- Efficiency: Visual representations of data can save time when analyzing results, allowing researchers to quickly identify patterns and draw conclusions.
- Communication: Charts can effectively communicate findings to others, whether in presentations, reports, or publications.
Types of Research Notebook Charts
There are several types of charts that can be used in research notebooks, each serving a different purpose. Here are some common types:
Tables
Tables are used to organize and present data in a structured format. They allow researchers to compare different variables and make it easy to identify trends. When creating a table, ensure that it is clearly labeled and that the data is organized logically.
Graphs
Graphs are powerful tools for visualizing data. They can take various forms, including line graphs, bar graphs, and pie charts. Each type of graph serves a different purpose:
- Line Graphs: Ideal for showing trends over time or continuous data.
- Bar Graphs: Useful for comparing discrete categories or groups.
- Pie Charts: Effective for illustrating proportions and percentages.
Flowcharts
Flowcharts are used to represent processes or workflows visually. They can help researchers outline experimental procedures, decision-making processes, or the relationships between different variables. Flowcharts can simplify complex information and make it easier to follow.
Diagrams
Diagrams can be used to illustrate concepts, structures, or relationships in research. They can include everything from molecular structures in chemistry to experimental setups in biology. Diagrams help to clarify complex ideas and enhance understanding.
Creating Effective Research Notebook Charts
To create effective research notebook charts, consider the following tips:
Choose the Right Type of Chart
Select the type of chart that best represents the data you are working with. Consider the nature of the information and the message you want to convey. For example, use a line graph for time series data and a bar graph for categorical comparisons.
Keep It Simple
Avoid cluttering your charts with excessive information. Focus on the key data points and ensure that the chart is easy to read and understand. Use clear labels and legends to guide the viewer.
Use Consistent Formatting
Maintain consistency in formatting across your charts. Use the same colors, fonts, and styles to create a cohesive look. This will make it easier for others to follow your work and understand your findings.
Label Clearly
Ensure that all axes, titles, and legends are clearly labeled. This will help viewers understand the context of the data and the significance of the chart.
Review and Revise
After creating your charts, take the time to review and revise them. Check for accuracy, clarity, and overall effectiveness. Seek feedback from peers or mentors to improve your charts further.
Maintaining an Organized Research Notebook
An organized research notebook is essential for effective documentation and data management. Here are some tips for maintaining your research notebook:
Regular Updates
Make it a habit to update your research notebook regularly. Document your experiments, observations, and findings as they occur to ensure that you capture all relevant information.
Use a Consistent Format
Establish a consistent format for your entries, including dates, headings, and sections. This will make it easier to navigate your notebook and locate specific information when needed.
Keep It Neat
Maintain a neat and tidy notebook. Avoid crossing out or erasing entries, as this can create confusion. Instead, use correction fluid or simply add a note to clarify any changes.
Include References
If you reference external sources or previous experiments, be sure to include citations or notes in your notebook. This will help you keep track of your research and provide context for your findings.
Backup Your Work
Consider keeping a digital backup of your research notebook. This can be done by scanning pages or using note-taking apps that allow you to document your work electronically. A backup ensures that your research is preserved in case of loss or damage to the physical notebook.

Conclusion
Research notebook charts are invaluable tools for documenting and analyzing data in scientific research. By understanding the importance of these charts and how to create them effectively, you can enhance your research process and improve your overall productivity. With the right approach to organizing your research notebook, you can ensure that your findings are clear, accessible, and impactful.
How to purchase:Online B2B sourcing platform, China purchase, Chinese suppliers – LooperBuy
Frequently Asked Questions
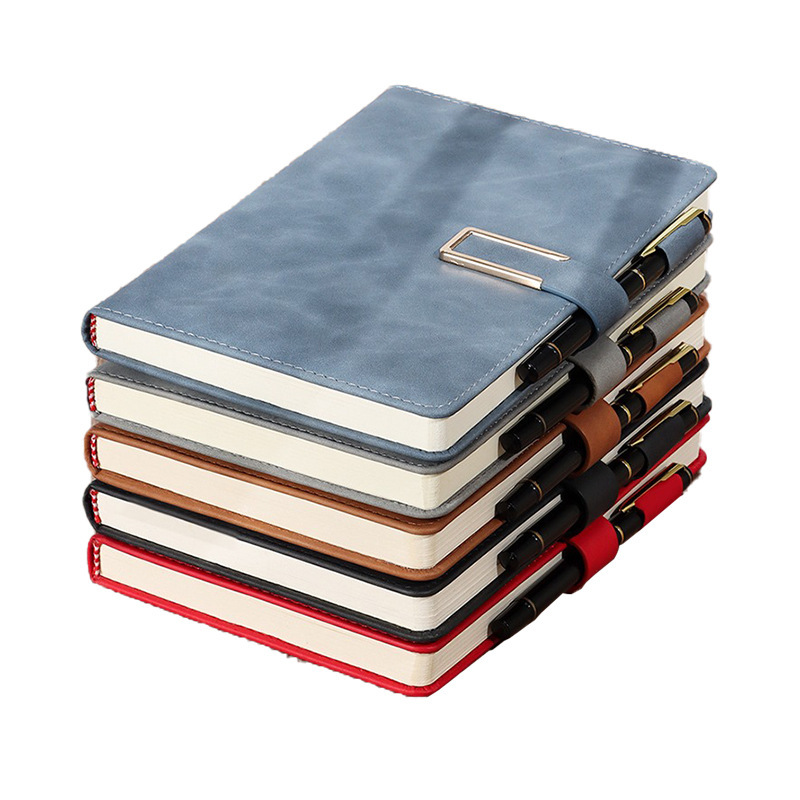
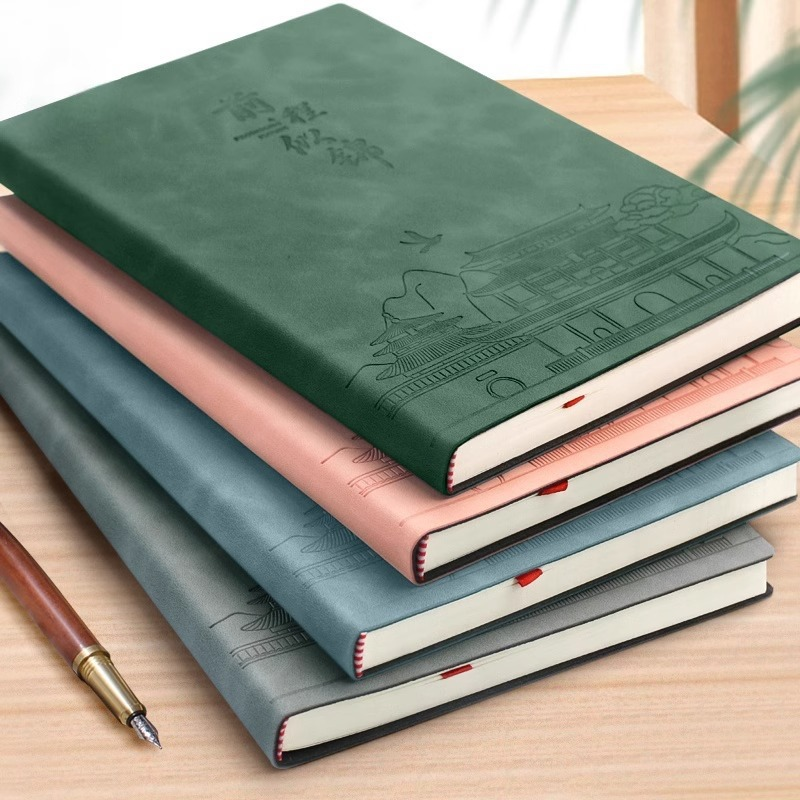
1.What are the best materials for a research notebook?
The best materials for a research notebook include high-quality, acid-free paper that can withstand ink and prevent bleeding. Look for notebooks with durable covers to protect your entries.
2.How do I measure my headphones for a custom crochet cover?
To measure your headphones, use a soft measuring tape to measure the diameter of the ear pads and the length of the headband. Refer to the sizing chart provided by the manufacturer for accurate sizing.
3.What are some popular styles of research notebook charts?
Popular styles of research notebook charts include tables, line graphs, bar graphs, pie charts, flowcharts, and diagrams. Each style serves a different purpose and can effectively convey information.
4.Can I use digital tools for my research notebook?
Yes, many researchers use digital tools and apps to maintain their research notebooks. These tools can offer features such as easy organization, searchability, and backup options.
5.How often should I update my research notebook?
It is best to update your research notebook regularly, documenting experiments, observations, and findings as they occur. This ensures that you capture all relevant information in real-time.
Hot Tag: research notebook charts, data visualization, scientific documentation, effective research practices, academic tools, collaboration in research, digital research notebooks, chart creation tips, organizing research data, enhancing productivity, visual data representation, research methodologies, common mistakes in research, improving research outcomes, academic success strategies.